IoT data analytics
By John Kirch
04 August 2023 - v1.3
emnify provides a comprehensive solution for connecting IoT devices to over 540 mobile network providers in more than 180 countries. To provide their customers with a truly global experience, data is routed through their Amazon AWS VPN and made accessible via 4 AWS regions around the world.
The metadata emnify collects is important for a number of reasons and use cases:
-
Tracking data and SMS usage can help reduce monthly costs.
-
Identifying IoT devices that are offline due to power supply problems, malfunction, theft, etc.
-
Discovering usage trends based on aggregated data, e.g., hourly, daily, by weekday, weekly, monthly, quarterly, or annual.
-
Security: authentication failures, unusual data usage spikes or excessive SMS messages received can be indicative of attempts to gain unauthorized access to IoT devices.
However, the tools and reports that the web-based emnify Portal provides do not always meet every customer’s needs due to various factors.
-
Reporting is not always customizable, e.g., event descriptions are collapsed by default and can only be expanded per the currently selected event.
-
Although many reports are customizable regarding date ranges and other filters, the results can take several seconds to appear, presumably due to the multitenancy environment and other factors.
-
Raw data usage for each IoT device is not visible, only aggregated usage.
| Because IoT devices are so diverse and collect such a variety of data, this post focuses on the mobile network metadata they generate for maintaining connectivity. For an example of sensor-based data, see IOT Data analysis - data from 54 sensors and the dataset it uses. |
Managing IoT metadata and creating a custom data analytics solution
In this post, you will acquire skills for visualizing data from the emnify Data Streamer according to your organization’s specific reporting needs. To achieve this, you will learn how to integrate the following third-party solutions into your workflow: NXLog, Raijin, Python pandas, and Python seaborn.
The exercises presented in this post will guide you through the following tasks:
-
Create webhooks for NXLog to capture emnify metadata
-
Capture raw, unprocessed logs for long-term archival
-
Prepare the logs for insertion in a Raijin database
-
Explore the metadata in Raijin using SQL queries
-
Write queries for analyzing various distributions by categories
-
Use Jupyter with Python data analysis libraries to explore and visualize the metadata for creating reports
Before you start, you will need to get acquainted with the emnify metadata and infrastructure that delivers it.
The IoT log source
The emnify Data Streamer takes the IoT connection metadata, formats it as JSON records, and sends it to subscribers in real time. emnify allows you to subscribe to this data using webhooks. NXLog can capture this data and provide additional functionality that emnify cannot provide without third-party integrations:
-
Data archival for generating quarterly, annual, or lifetime metrics
-
Forwarding the data captured in real time to a Raijin database to leverage its time series capabilities for forensic purposes
-
Filter security events and forward them in real time to a SIEM
| emnify provides integrations with a small number of third-party data analytics solutions. However, unlike NXLog, they currently do not provide SIEM integrations with Google Chronicle, IBM QRadar, Microsoft Sentinel, Securonix, Splunk, or Sumo Logic, just to name a few. |
emnify metadata types
The metadata emnify provides can be viewed in real time via the web-based emnify Portal. The emnify Data Streamer provides two basic types of metadata:
-
Data and SMS usage
-
Mobile data uploaded (in MB)
-
Mobile data downloaded (in MB)
-
Number of SMS messages sent
-
Number of SMS messages received
-
-
Events
-
Type
-
Severity
-
Description
-
Sample Data Streamer usage records (1 Data and 1 SMS)
{
    "cost": 0.0304797,
    "id": 961767216873563,
    "operator": {
      "id": 5,
      "name": "Telefonica O2",
      "mnc": "07",
      "country": {
        "id": 74,
        "mcc": "262",
        "name": "Germany"
      }
    },
    "organisation": {
      "id": 543210,
      "name": "7LX Solutions Ltd"
    },
    "tariff": {
      "id": 557,
      "name": "Regional Pro EUR",
      "ratezone": {
        "id": 3398,
        "name": "Europe Basic"
      }
    },
    "traffic_type": {
      "id": 5,
      "description": "Data"
    },
    "endpoint": {
      "id": 31432106,
      "name": "IoT Device 008",
      "ip_address": "10.196.67.36",
      "tags": "DE,NRW,OP,S1",
      "imei": "3344098765432102",
      "balance": null
    },
    "imsi": "295098765432118",
    "volume": {
      "total": 0.304797,
      "rx": 0.10377,
      "tx": 0.201027
    },
    "start_timestamp": "2023-06-01T21:44:13Z",
    "sim": {
      "id": 19356708,
      "iccid": "69476543210136526897",
      "msisdn": "429555555555508",
      "production_date": "2020-12-23T13:14:43Z"
    },
    "currency": {
      "id": 1,
      "code": "EUR",
      "symbol": "€"
    },
    "end_timestamp": "2023-06-01T22:00:00Z",
    "imsi_id": 59876512
  }
  {
    "cost": 0.01,
    "id": 951100051194091,
    "operator": {
      "id": 29,
      "name": "Proximus",
      "mnc": "01",
      "country": {
        "id": 22,
        "mcc": "206",
        "name": "Belgium"
      }
    },
    "organisation": {
      "id": 543210,
      "name": "7LX Solutions Ltd"
    },
    "tariff": {
      "id": 1,
      "name": "Internal Test Tariff",
      "ratezone": {
        "id": 1,
        "name": "Zone 1"
      }
    },
    "traffic_type": {
      "id": 6,
      "description": "SMS"
    },
    "endpoint": {
      "id": 31432106,
      "name": "IoT Device 008",
      "ip_address": "10.196.67.36",
      "tags": "DE,NRW,OP",
      "imei": "3344098765432102",
      "balance": null
    },
    "imsi": "295098765432118",
    "volume": {
      "total": 1,
      "rx": 0,
      "tx": 1
    },
    "start_timestamp": "2023-05-25T09:08:51Z",
    "sim": {
      "id": 19356708,
      "iccid": "69476543210136526897",
      "msisdn": "429555555555508",
      "production_date": "2020-12-23T13:14:43Z"
    },
    "currency": {
      "id": 1,
      "code": "EUR",
      "symbol": "€"
    },
    "end_timestamp": "2023-05-25T09:08:53Z",
    "imsi_id": 59876512
  }
Sample Data Streamer event record
{
    "id": 902815564038271,
    "timestamp": "2023-04-21T06:31:21Z",
    "event_source": {
      "id": 1,
      "description": "Policy Control"
    },
    "event_severity": {
      "id": 1,
      "description": "WARN"
    },
    "event_type": {
      "id": 11,
      "description": "Endpoint blocked"
    },
    "organisation": {
      "id": 543210,
      "name": "7LX Solutions Ltd"
    },
    "user": null,
    "alert": true,
    "description": "Blocking data access for endpoint, because organisation exceeded monthly limit.",
    "endpoint": {
      "id": 31432105,
      "name": "IoT Device 006",
      "ip_address": "10.196.67.33",
      "tags": "",
      "imei": "3344098765432111"
    },
    "sim": {
      "id": 19356703,
      "iccid": "69476543210186526892",
      "msisdn": "429555555555503",
      "production_date": "2019-10-10T13:06:16Z"
    },
    "imsi": {
      "id": 59876503,
      "imsi": "295098765432104",
      "import_date": "2019-10-10T13:06:16Z"
    },
    "detail": null
  }
Raw data collection limitations
As an emnify customer, the emnify Data Streamer is your only source of raw data usage logs. The emnify REST API only returns aggregated data for a specific IoT device. This method has serious limitations making it practically useless for security or forensic use cases:
-
You need make a separate request for each
endpoint_id(device ID). -
The data is aggregated by month or day.
-
The finest granularity of aggregated usage data is by minute, but only for the 60 minutes prior to the API request.
Setting up log collection and forwarding
Intuitively, you might be inclined to install/configure each component of this integration in the same order the data is traveling:
-
emnify webhooks
-
NXLog agent
-
Raijin database
However, we will work in the opposite direction to avoid error messages about unreachable hosts and undefined databases. Also, the emnify Portal expects the IP address and port number of each webhook to be reachable and capable of receiving POSTed data before you configure them.
| The emnify Data Streamer expects webhooks to be reachable from the internet. If you plan to install your NXLog agent behind a firewall, make sure the IP address and port numbers are open to the public. You might also consider port forwarding or installing a virtual host with a cloud provider if necessary. |
| If your organization is using Amazon AWS, check to see if they already have emnify Cloud Connect set up. With a functional AWS Transit Gateway, you could install an NXLog agent and Raijin on an EC2 instance that is already connected to your Transit Gateway. emnify has a video tutorial on how to configure Cloud Connect. This solution keeps all of your data private because you are working entirely within a VPN. |
Configure Raijin
If you are not already using the Raijin Database Engine to collect your logs for data analysis, install Raijin.
Since Raijin uses the HTTP protocol, your web browser serves as a Raijin client for sending SQL queries as well as creating, listing, and dropping databases and tables.
Just enter the hostname or IP address of the host where Raijin is installed with its default port 2500 to connect: http://<raijin-host>:2500/.
The first step is to set up a new database and tables for collecting metadata from the emnify Data Streamer:
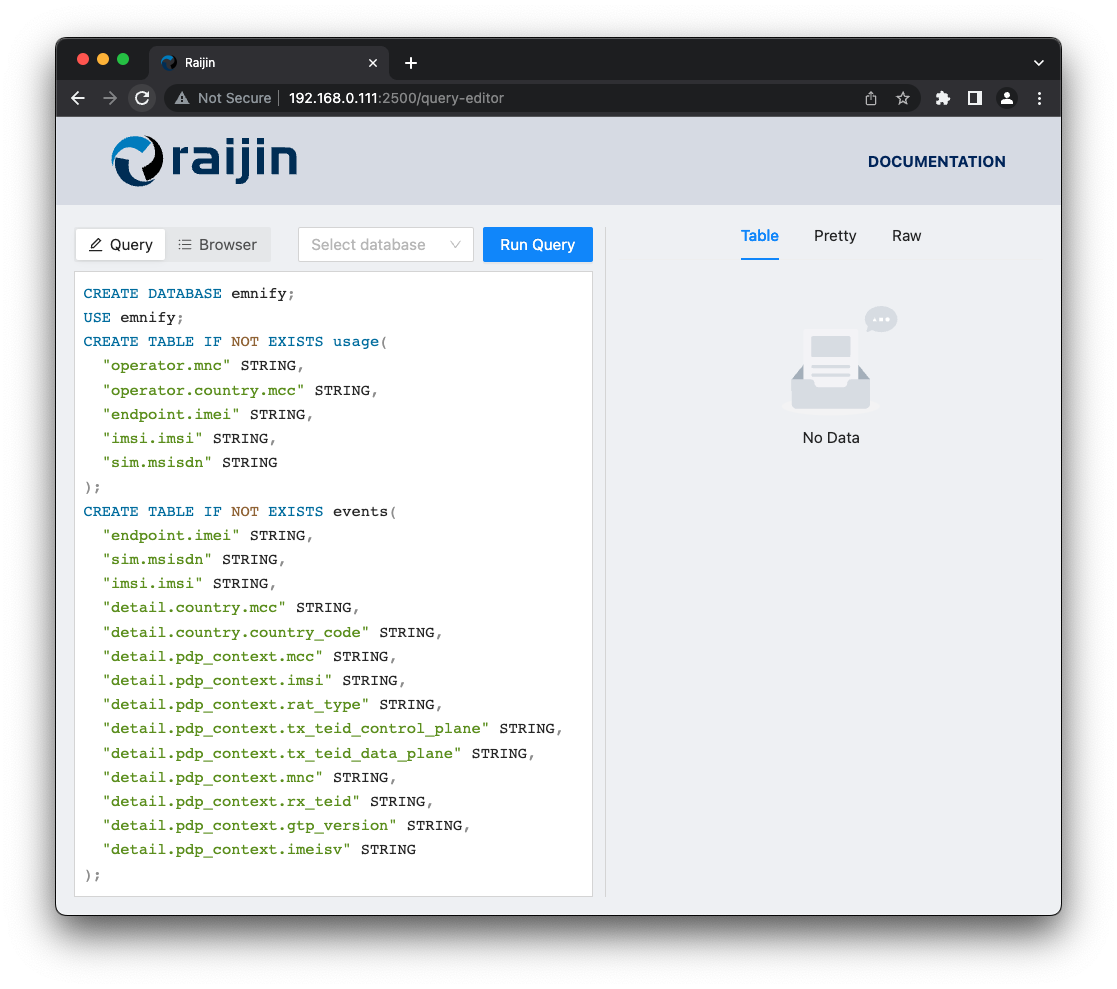
View/copy the SQL for setting up the new database and tables
CREATE DATABASE emnify;
USE emnify;
CREATE TABLE IF NOT EXISTS usage(
  "operator.mnc" STRING,
  "operator.country.mcc" STRING,
  "endpoint.imei" STRING,
  "imsi.imsi" STRING,
  "sim.msisdn" STRING
);
CREATE TABLE IF NOT EXISTS events(
  "endpoint.imei" STRING,
  "sim.msisdn" STRING,
  "imsi.imsi" STRING,
  "detail.country.mcc" STRING,
  "detail.country.country_code" STRING,
  "detail.pdp_context.mcc" STRING,
  "detail.pdp_context.imsi" STRING,
  "detail.pdp_context.rat_type" STRING,
  "detail.pdp_context.tx_teid_control_plane" STRING,
  "detail.pdp_context.tx_teid_data_plane" STRING,
  "detail.pdp_context.mnc" STRING,
  "detail.pdp_context.rx_teid" STRING,
  "detail.pdp_context.gtp_version" STRING,
  "detail.pdp_context.imeisv" STRING
);
Configure NXLog
If you are not already an NXLog customer, download NXLog Enterprise Edition v5 trial for your platform to get started for free. The Deployment section of the NXLog User Guide has instructions for all supported platforms if you have any questions.
Once you have NXLog installed, the next step is to find and edit your nxlog.conf configuration file.
On UNIX-like platforms the default path and filename are /opt/nxlog/etc/nxlog.conf.
The following configuration will enable you to:
-
Save a copy of the raw, unprocessed logs for long-term archival
-
Process and forward the logs for storage in your Raijin database
<Extension _json>
    Module      xm_json
    Flatten     TRUE (1)
</Extension>

# Receive data and SMS usage from the emnify Data Streamer
<Input usage_received>
    Module      im_http
    ListenAddr  0.0.0.0:1514

</Input>

# Receive event messages from the emnify Data Streamer
<Input events_received>
    Module      im_http
    ListenAddr  0.0.0.0:1515
</Input>

# Log emnify network and SMS usage data to file
<Output usage_log> (2)
    Module      om_file
    File        "emnify-usage.ndjson"
</Output>

# Log emnify events to file
<Output event_log>
    Module      om_file
    File        "emnify-events.ndjson"
</Output>

# Forward emnify network and SMS usage data to Raijin
<Output raijin_usage>
    Module      om_raijin
    URL         http://192.168.0.111:2500
    DBName      emnify
    DBTable     usage
    <Exec>
        parse_json(); (3)
        delete($id); (4)
        to_json(); (5)
    </Exec>
</Output>

# Forward emnify events to Raijin
<Output raijin_events>
    Module      om_raijin
    URL         http://192.168.0.111:2500
    DBName      emnify
    DBTable     events
    <Exec>
        parse_json();
        delete($id);
        to_json();
    </Exec>
</Output>

<Route usage_route>
    Path        usage_received   => usage_log, raijin_usage
</Route>

<Route event_route>
    Path        events_received  => event_log, raijin_events
</Route>| 1 | Setting the Flatten directive to TRUE converts nested JSON key-value pairs to dot notation in order to deliver a flattened JSON structure to Raijin. |
| 2 | Both the usage_log and event_log output modules write the raw, structured JSON objects to file in NDJSON format.
This preserves the captured metadata in an unaltered state in case it ever needs to be reloaded into Raijin. |
| 3 | The raw JSON payload needs to be parsed as JSON before it can be processed. |
| 4 | The original emnify primary key id can be discarded because it is only of value within the confines of the native emnify database. Since emnify customers don’t have access to the database, these primary keys are merely excess baggage that waste storage. |
| 5 | Calling the to_json() procedure will output flattened JSON objects that the Raijin database server supports. |
Restart the NXLog service for the changes to take effect.
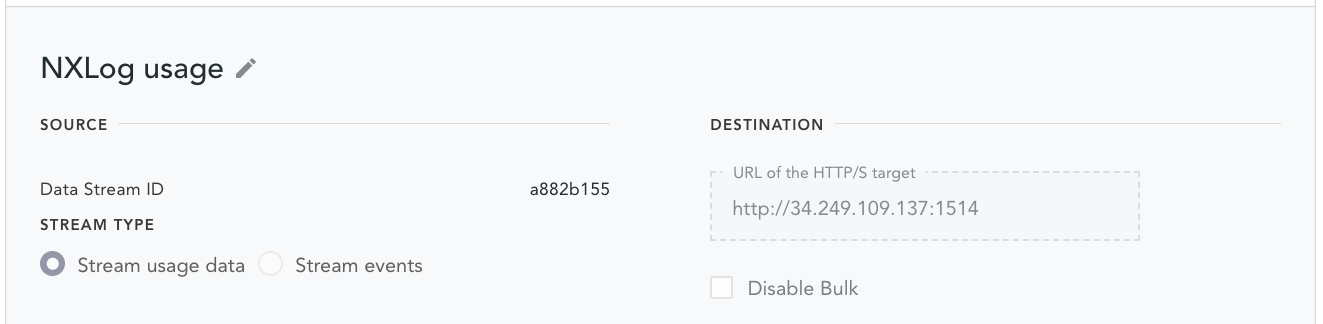
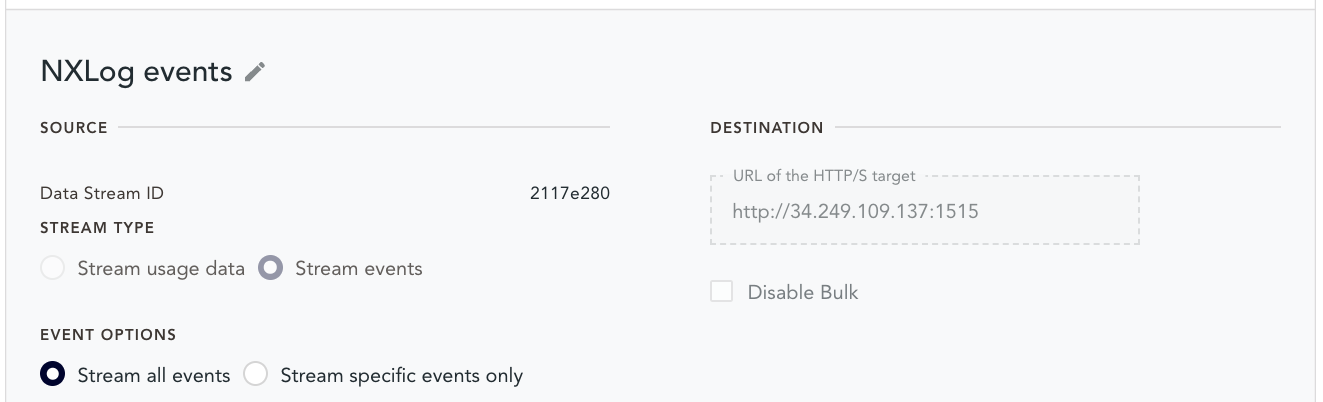
Configure the webhooks
The emnify Portal provides an Integrations section where webhooks can be configured.
Create your webhooks using the IP address of the NXLog host and the port numbers you used for the ListenAddr directives in your NXLog configuration.
Triggering events and data usage
Now that you have configured the required components, you will need to ensure that you have at least one IoT device equipped with an emnify IoT eSIM that is powered up. If you do not want to wait for events or data usage statistics to be generated, you can force some events by restarting the device.
If one of your emnify-enabled mobile devices is a smart phone, you could send an SMS text or open an application that requires a connection for generating new data usage logs.
To receive SMS messages, the Connected Devices section of the emnify Portal provides an SMS console for sending SMS messages to your IoT devices.
This feature is useful since many industrial IoT devices can be configured through special AT commands sent via SMS.
Verify the setup
If you are seeing new events and usage logs appearing in the emnify Portal, query the Raijin database to confirm that the metadata is being inserted by checking the row count of both tables:
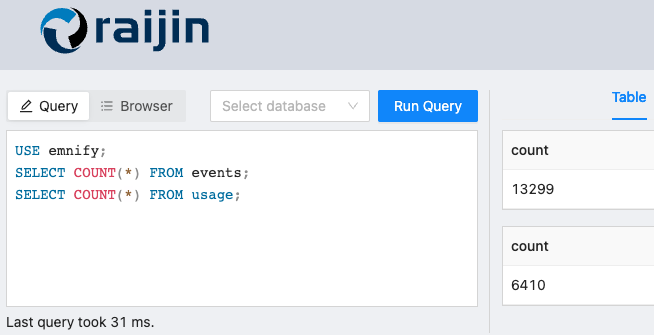
COUNT(*) to verify data ingestionCopy the SQL
USE emnify;
SELECT COUNT(*) FROM events;
SELECT COUNT(*) FROM usage;
Troubleshooting
If the Raijin tables are empty, make sure that the webhook configurations are correct and the NXLog agent is capturing the raw data:
On the NXLog host, ensure that the raw data files are not empty:
# cd /opt/nxlog/var/spool/nxlog
# ls -s1
total 18140
12984 emnify-events.ndjson
 5156 emnify-usage.ndjson
If both files are empty, consult the Troubleshooting section of the NXLog User Guide.
If NXLog is capturing the metadata but the Raijin tables are still empty, consult the Raijin and NXLog logs.
# cd /opt/nxlog/var/log/nxlog
# tail nxlog.log# cd /opt/raijin/log
# tail raijin.logExploring the metadata with Raijin
The first step in exploring data is to find out which fields might be important and what data types they use.
The SQL DESCRIBE command will provide this information.
Events
From a security perspective, the events table is most important.
events tableUSE emnify;
DESCRIBE events;Show the results of DESCRIBE events (95 fields)
| field | type |
|---|---|
endpoint.imei |
STRING |
sim.msisdn |
STRING |
imsi.imsi |
STRING |
detail.country.mcc |
STRING |
detail.country.country_code |
STRING |
detail.pdp_context.mcc |
STRING |
detail.pdp_context.imsi |
STRING |
detail.pdp_context.rat_type |
STRING |
detail.pdp_context.tx_teid_control_plane |
STRING |
detail.pdp_context.tx_teid_data_plane |
STRING |
detail.pdp_context.mnc |
STRING |
detail.pdp_context.rx_teid |
STRING |
detail.pdp_context.gtp_version |
STRING |
detail.pdp_context.imeisv |
STRING |
MessageSourceAddress |
STRING |
EventReceivedTime |
DATETIME |
SourceModuleName |
STRING |
SourceModuleType |
STRING |
timestamp |
DATETIME |
event_source.id |
UINT32 |
event_source.description |
STRING |
event_severity.id |
UINT32 |
event_severity.description |
STRING |
event_type.id |
UINT32 |
event_type.description |
STRING |
organisation.id |
UINT32 |
organisation.name |
STRING |
alert |
BOOL |
description |
STRING |
endpoint.id |
UINT32 |
endpoint.name |
STRING |
endpoint.ip_address |
STRING |
endpoint.tags |
STRING |
sim.id |
UINT32 |
sim.iccid |
STRING |
sim.production_date |
DATETIME |
imsi.id |
UINT32 |
imsi.import_date |
DATETIME |
detail.country.iso_code |
STRING |
detail.country.id |
UINT32 |
detail.country.name |
STRING |
detail.id |
UINT32 |
detail.pdp_context.apn |
STRING |
detail.pdp_context.tunnel_created |
DATETIME |
detail.pdp_context.ratezone_id |
INT32 |
detail.pdp_context.ci |
UINT32 |
detail.pdp_context.ggsn_control_plane_ip_address |
STRING |
detail.pdp_context.pdp_context_id |
VARIANT |
detail.pdp_context.sgsn_data_plane_ip_address |
STRING |
detail.pdp_context.ggsn_data_plane_ip_address |
STRING |
detail.pdp_context.breakout_ip |
STRING |
detail.pdp_context.ue_ip_address |
STRING |
detail.pdp_context.operator_id |
INT32 |
detail.pdp_context.sgsn_control_plane_ip_address |
STRING |
detail.pdp_context.nsapi |
UINT32 |
detail.pdp_context.tariff_id |
INT32 |
detail.pdp_context.tariff_profile_id |
INT32 |
detail.pdp_context.region |
STRING |
detail.name |
STRING |
detail.volume.rx |
VARIANT |
detail.volume.tx |
VARIANT |
detail.volume.total |
VARIANT |
detail.tapcode |
STRING |
detail.mnc |
STRING |
detail.stale |
BOOL |
user.id |
UINT32 |
user.username |
STRING |
user.name |
STRING |
detail.user.id |
INT32 |
detail.user.username |
STRING |
detail.support_user_org.id |
UINT32 |
detail.support_user_org.name |
STRING |
detail.tariff_plan.id |
UINT32 |
detail.tariff_plan.name |
STRING |
detail.tariff_plan.start_date |
DATETIME |
detail.tariff_plan.end_date |
DATETIME |
detail.tariff_plan.evaluation |
BOOL |
detail.tariff_plan.expiry_time |
UINT32 |
detail.tariff_plan.price.sim_activated_rate |
STRING |
detail.tariff_plan.rate |
UINT32 |
detail.tariff_plan.yearly_rate |
UINT32 |
detail.tariff_plan.currency.id |
UINT32 |
detail.tariff_plan.service_level.id |
UINT32 |
detail.customer_id |
INT64 |
detail.payment_token |
STRING |
detail.preferred_payment_option_id |
UINT32 |
detail.username |
STRING |
detail.breakout_id |
UINT32 |
detail.creation_date |
DATETIME |
detail.region |
STRING |
detail.resource_share_name |
STRING |
detail.breakout_type_id |
UINT32 |
detail.breakout_type |
STRING |
detail.price |
UINT32 |
detail.pdp_context.lac |
UINT32 |
The next step is to identify and confirm fields that function as categories. In this case, these two fields appear to be candidates:
-
event_severity.description -
event_type.description
For this purpose, you can use the SQL SELECT DISTINCT <field name> to see if any categories emerge.
USE emnify;
SELECT DISTINCT "event_severity.description"
FROM events;
This query returns two categories:
-
INFO -
WARN
USE emnify;
SELECT DISTINCT "event_type.description"
FROM events
ORDER BY "event_type.description";
This query returns a much longer list of categories that you might find useful for future queries involving types of events.
Show all 23 categories
-
Billing configuration updated
-
CloudConnect TGW breakout terminated
-
Create PDP Context
-
Data quota enabled
-
Delete PDP Context
-
Endpoint blocked
-
Endpoint data traffic limit warning
-
Endpoint disabled
-
Endpoint enabled
-
Generic
-
Organisation blocked
-
Purge GPRS location
-
Purge location
-
SIM Assigned
-
SIM Released
-
SIM activation
-
SIM suspension
-
Support Access
-
Tariff plan updated
-
Update GPRS location
-
Update location
-
User authentication failed
-
User deleted
With the ability to write ad hoc SQL queries, Raijin can provide tabular views of events that are not possible with the views available in emnify Portal Dashboard or Connected Devices » Details » Events where you will find Severity and Event Type but not Event Description. From the following query, you can see that Event Type tells very little about what has actually happened.
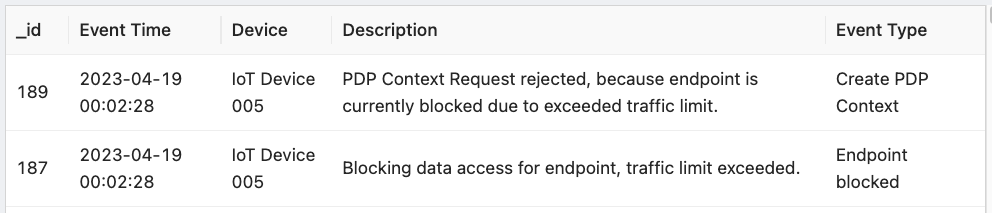
View/copy the SQL for this query
USE emnify;
SELECT _id,
       CONCAT(
         DATE(timestamp), ' ', TIME(timestamp)
       ) AS "Event Time",
       "endpoint.name" AS "Device",
       description AS "Description",
       "event_type.description" AS "Event Type"
FROM   events
WHERE  MATCH ("description") AGAINST('exceeded')
ORDER BY "endpoint.name",
         timestamp
From the query results above, you can see that both events are the result of data traffic limit that was configured in the Service Policy for this device. From the Description field, you would never imagine that these two event types, Create PDP Context and Endpoint blocked would ever have anything in common.
Data and SMS usage
From the data contained in the usage table, you can track your costs and gain insights on usage trends.
usage tableUSE emnify;
DESCRIBE usage;Show the results of DESCRIBE usage (39 fields)
| field | type |
|---|---|
operator.mnc |
STRING |
operator.country.mcc |
STRING |
endpoint.imei |
STRING |
imsi.imsi |
STRING |
sim.msisdn |
STRING |
MessageSourceAddress |
STRING |
EventReceivedTime |
DATETIME |
SourceModuleName |
STRING |
SourceModuleType |
STRING |
cost |
VARIANT |
operator.id |
UINT32 |
operator.name |
STRING |
operator.country.id |
UINT32 |
operator.country.name |
STRING |
organisation.id |
UINT32 |
organisation.name |
STRING |
tariff.id |
UINT32 |
tariff.name |
STRING |
tariff.ratezone.id |
UINT32 |
tariff.ratezone.name |
STRING |
traffic_type.id |
UINT32 |
traffic_type.description |
STRING |
endpoint.id |
UINT32 |
endpoint.name |
STRING |
endpoint.ip_address |
STRING |
endpoint.tags |
STRING |
imsi |
INT64 |
volume.total |
VARIANT |
volume.rx |
VARIANT |
volume.tx |
VARIANT |
start_timestamp |
DATETIME |
sim.id |
UINT32 |
sim.iccid |
STRING |
sim.production_date |
DATETIME |
currency.id |
UINT32 |
currency.code |
STRING |
currency.symbol |
STRING |
end_timestamp |
DATETIME |
imsi_id |
UINT32 |
Data usage for a specific month
Creating customs data usage reports for a variety of time spans is possible now that you have raw data and the ability to write aggregation queries using SQL.
In the following exercise, the database should report device data usage for a single month, May 2023. The following metrics should be returned for each IoT device:
-
Device: Device name
-
RX: Data received (MB)
-
TX: Data transmitted (MB)
-
Combined: Total data traffic (MB) for both received and transmitted data
-
Duration: Total time spent receiving/transmitting data (in seconds)
-
Sessions: Number of data transfer sessions
Raijin’s native SQL functionality is indispensible for such reports.
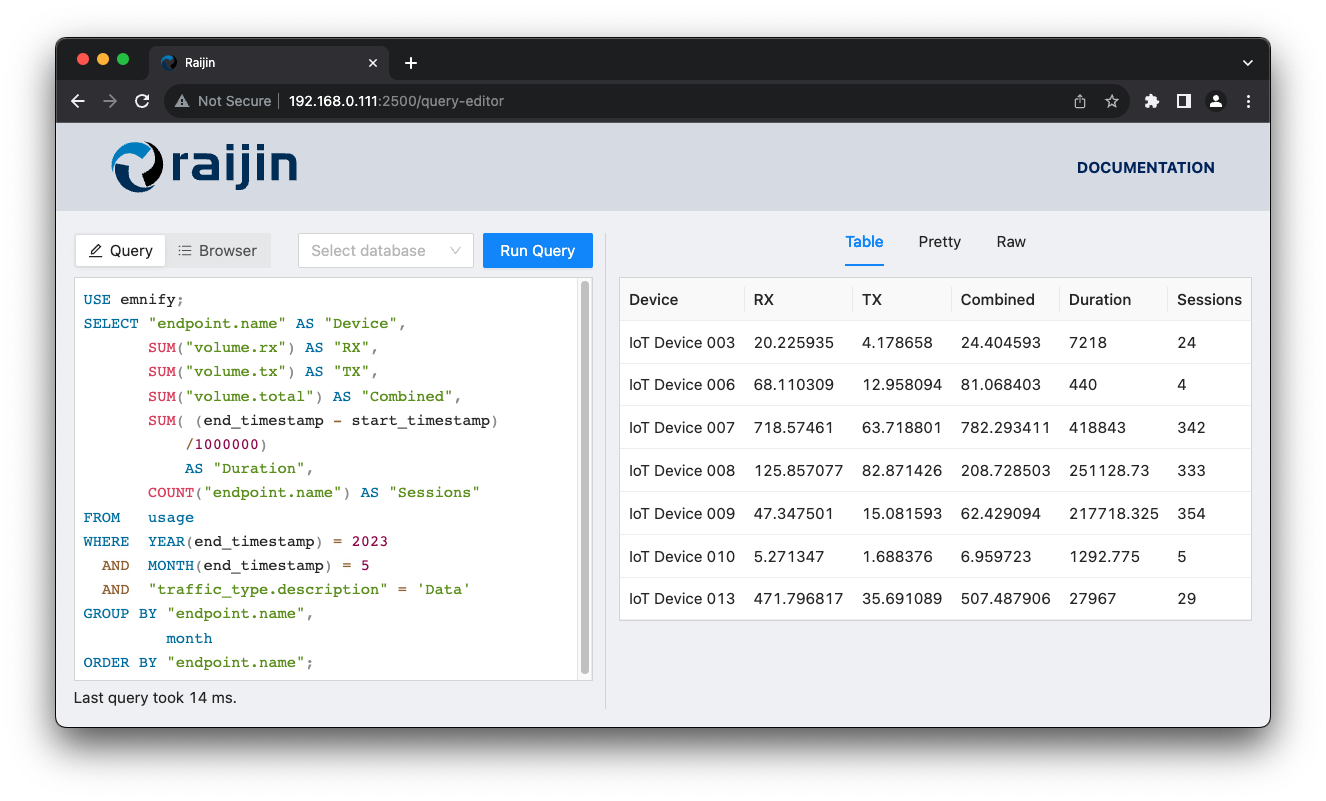
View/copy the SQL for this query
USE emnify;
SELECT "endpoint.name" AS "Device",
       SUM("volume.rx") AS "RX",
       SUM("volume.tx") AS "TX",
       SUM("volume.total") AS "Combined",
       SUM( (end_timestamp - start_timestamp)/1000000) AS "Duration",
       COUNT("endpoint.name") AS "Sessions"
FROM   usage
WHERE  YEAR(end_timestamp) = 2023
  AND  MONTH(end_timestamp) = 5
  AND  "traffic_type.description" = 'Data'
GROUP BY "endpoint.name",
         month
ORDER BY "endpoint.name";
Visualizing data with Python and Jupyter Notebook
Data analysis requires visualization of data distributions. With Python and its libraries specifically written for data science, you can gain insights that would otherwise not be possible.
Jupyter Notebook is an interactive development environment for testing and collaborating with others. It integrates editable code and documentation in a single package. By selecting Run All, Python code cells will be executed sequentially. See Structure of a notebook document for more information. See Create a Jupyter notebook file if you would like create your notebook and run it within Visual Studio Code.
For the exercises in this tutorial, your Python environment will require the following libraries:
import seaborn as sns
import matplotlib.pyplot as plt
import numpy as np
import pandas as pd
import requests as req
import json as json
| Most Jupyter Notebook resources recommend Anaconda for managing your Python environments. |
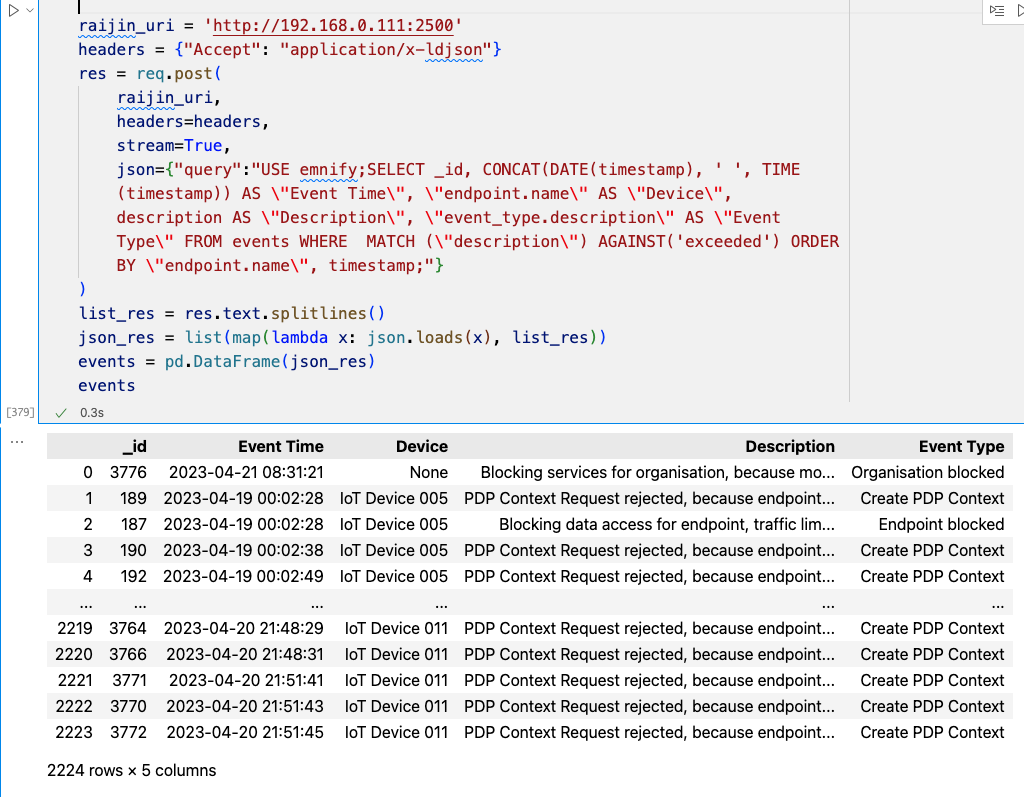
Querying Raijin with Python
In this Jupyter notebook, the following Python code cell demonstrates how you can query a Raijin database and transform the Raijin response into a pandas DataFrame.
Finally, invoking the name of the pandas DataFrame events outputs a tabular view of the data.
View/copy the SQL for this query
USE emnify;
SELECT _id,
       CONCAT(
         DATE(timestamp), ' ', TIME(timestamp)
       ) AS "Event Time",
       "endpoint.name" AS "Device",
       description AS "Description",
       "event_type.description" AS "Event Type"
FROM   events
WHERE  MATCH ("description") AGAINST('exceeded')
ORDER BY "endpoint.name",
         timestamp
Create a Python function for querying Raijin
It is more efficient to create a Python function from the code required to take an SQL statement, send it to Raijin, receive a response, and convert it to a pandas DataFrame. Another good practice is to store each SQL query as a file. SQL stored as files enables you to:
-
Add queries to a Git repository for maintaining version control
-
Create multiline, indented SQL for easier visualization of the various functional elements of a query
-
Include them as external code samples in your documentation
queryRaijin(filename,raijin_uri) function# Dependencies
# ------------
# import pandas as pd
# import requests as req
# import json as json
def queryRaijin(
filename,
raijin_uri = 'http://192.168.0.111:2500'
):
headers = {"Accept": "application/x-ldjson"}
with open(filename) as file:
lines = [line.rstrip() for line in file]
sql = ' '.join(lines)
sql = sql.replace(' ',' ')
query = {"query": ''}
query['query'] = sql
jsonquery = json.dumps(query)
res = req.post(
raijin_uri,
headers=headers,
stream=True,
data=json.dumps(query)
)
list_res = res.text.splitlines()
json_res = list(map(lambda x: json.loads(x), list_res))
return pd.DataFrame(json_res)Using the function
After copying the SQL from the previous exercise to a file called emnify-events-match-exceeded.sql, you can now create the same pandas DataFrame from above by providing the filename to the new function:
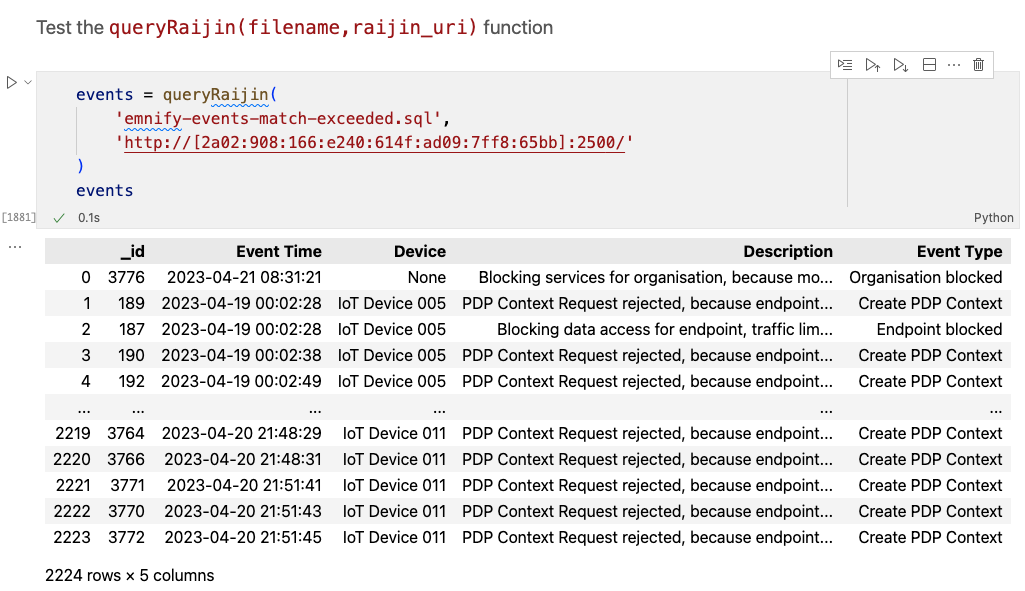
When you run this in your Jupyter notebook, you should see the same 2,224 rows of 5 fields displayed above.
Using seaborn to plot data
Within Jupyter Notebook, you can use plotting libraries like seaborn to visualize your data. The seaborn library is especially suited to plotting data distributions from pandas DataFrames. In most cases, data manipulation is not required, only a single function call with a few parameters will suffice.
Using the previous DataFrame, the following Jupyter Notebook code cell sets the style of the plot, customizes the title and labels for each axis, and defines a histogram that will aggregate events by device name on the x-axis.
# Remove the top and right borders of the plot
custom_params = {
    "axes.spines.right": False,
    "axes.spines.top": False,
    "ytick.left": True
}

# Apply the custom params and set the theme
sns.set_theme(style='whitegrid', palette='pastel', rc=custom_params)

# Define the seaborn plot
exceeded = sns.histplot(
    events,
    x='Device',
    hue='Device'
)

# Create a title and override the default axis labels
exceeded.set(
    title='emnify device policy limits exceeded: (All dates)',
    xlabel='Registered Devices',
    ylabel='Event Count'
)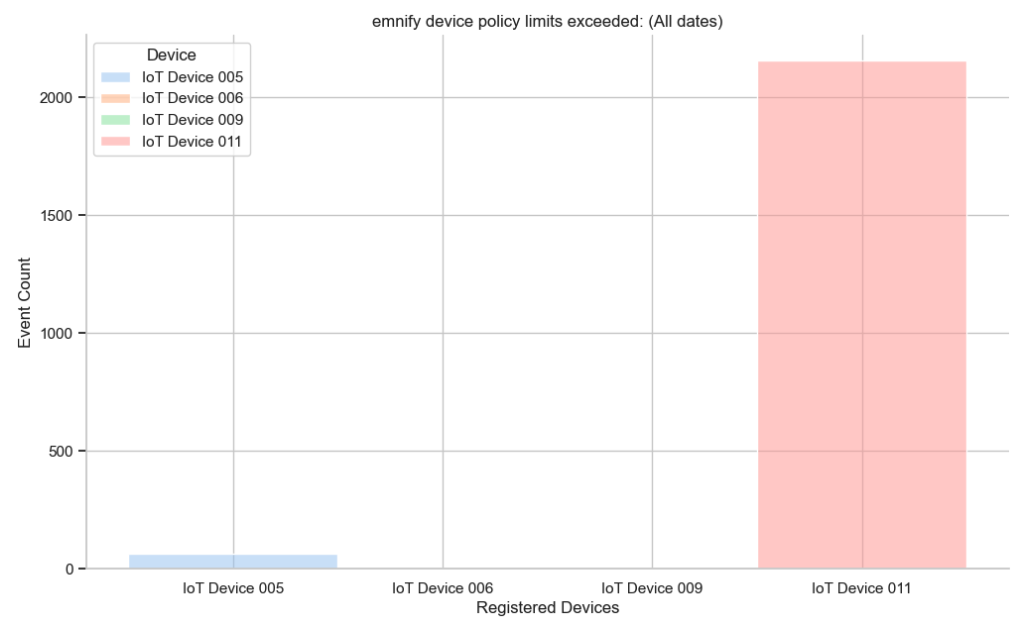
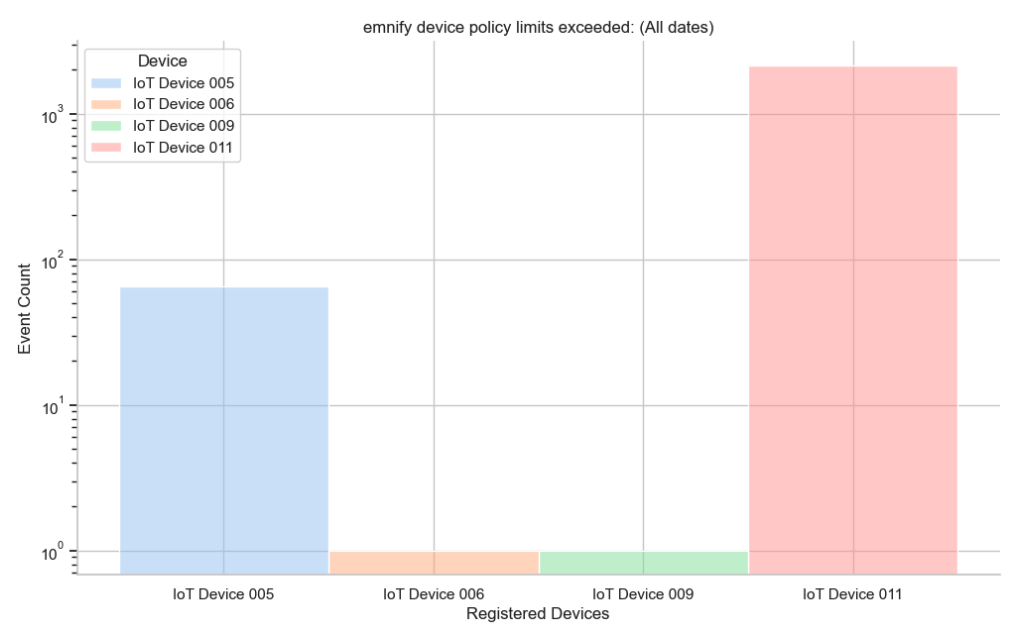
Because of the extreme range of event count across IoT devices, an additional line is needed to change the y-axis to a logarithmic scale.
# Define the seaborn plot
# Use a logarithmic scale for the y-axis
exceeded = sns.histplot(
    events,
    x='Device',
    hue='Device',
    log_scale=(False,True)
)
Identifying duplicate events for exclusion
From the previous exercise, you saw the problem that an extreme range of values presents when plotting data. When an application continually logs the same message in short intervals until the state/error/warning changes, generating a histogram that accurately describes the true distribution of event categories is impossible. NXLog can filter duplicate events. However, you need to first identify which events are duplicates and find a way to define them.
Plotting a histogram of events by day of year
By converting each warning event’s timestamp to the day number of the current year, you can create a dataset for plotting a histogram of the number of warnings per day.
USE emnify;
SELECT DAYOFYEAR(timestamp) AS "Day",
       "event_type.description",
       timestamp
FROM   events
WHERE  "event_severity.id" = 1 /* WARNING */
ORDER BY timestamp;warnings = queryRaijin('emnify-events-warning.sql')
warnings_dist = sns.displot(
warnings,
x='Day',
height=7, # make the plot 7 units high
aspect=2
)
warnings_dist.set(title='emnify Events: Distribution of warnings')
plt.xticks(np.arange(60, 180, step=5), rotation=90)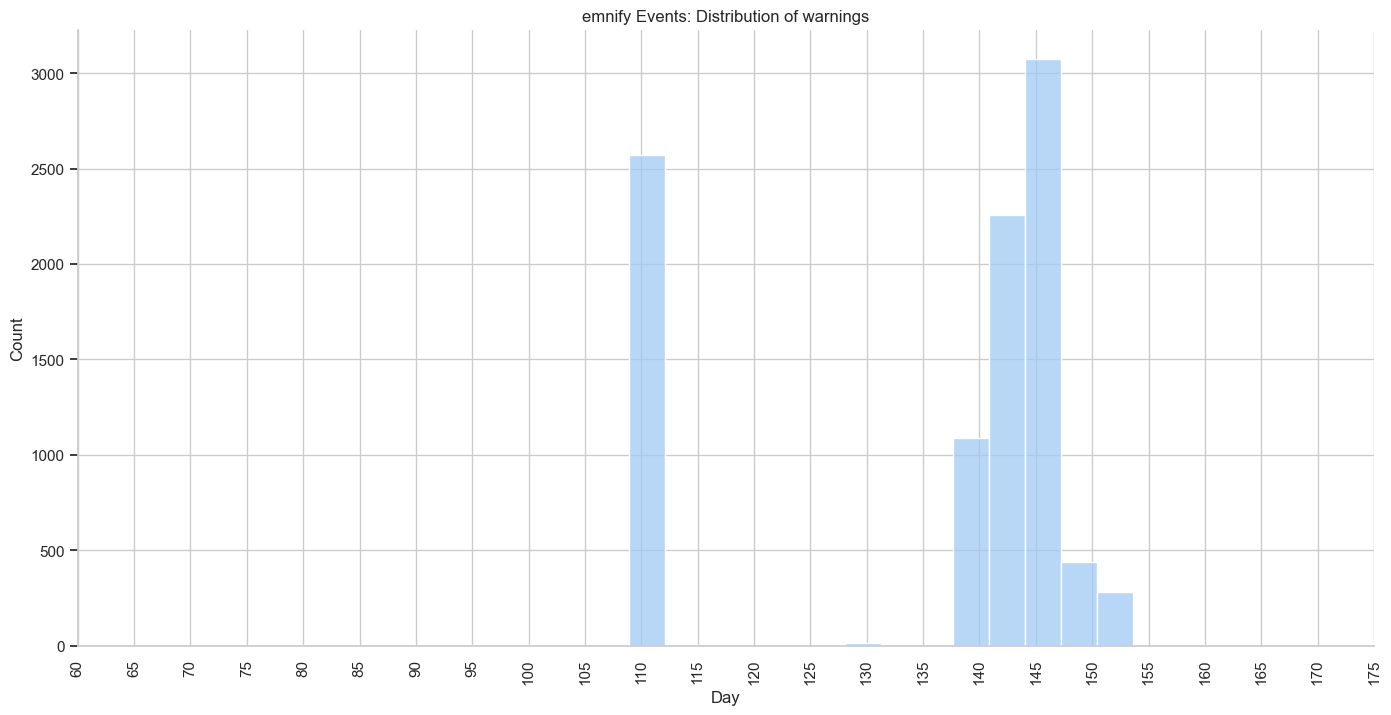
# Define the seaborn plot
# Use a logarithmic scale for the y-axis
exceeded = sns.histplot(
    events,
    x='Device',
    hue='Device',
    log_scale=(False,True)
)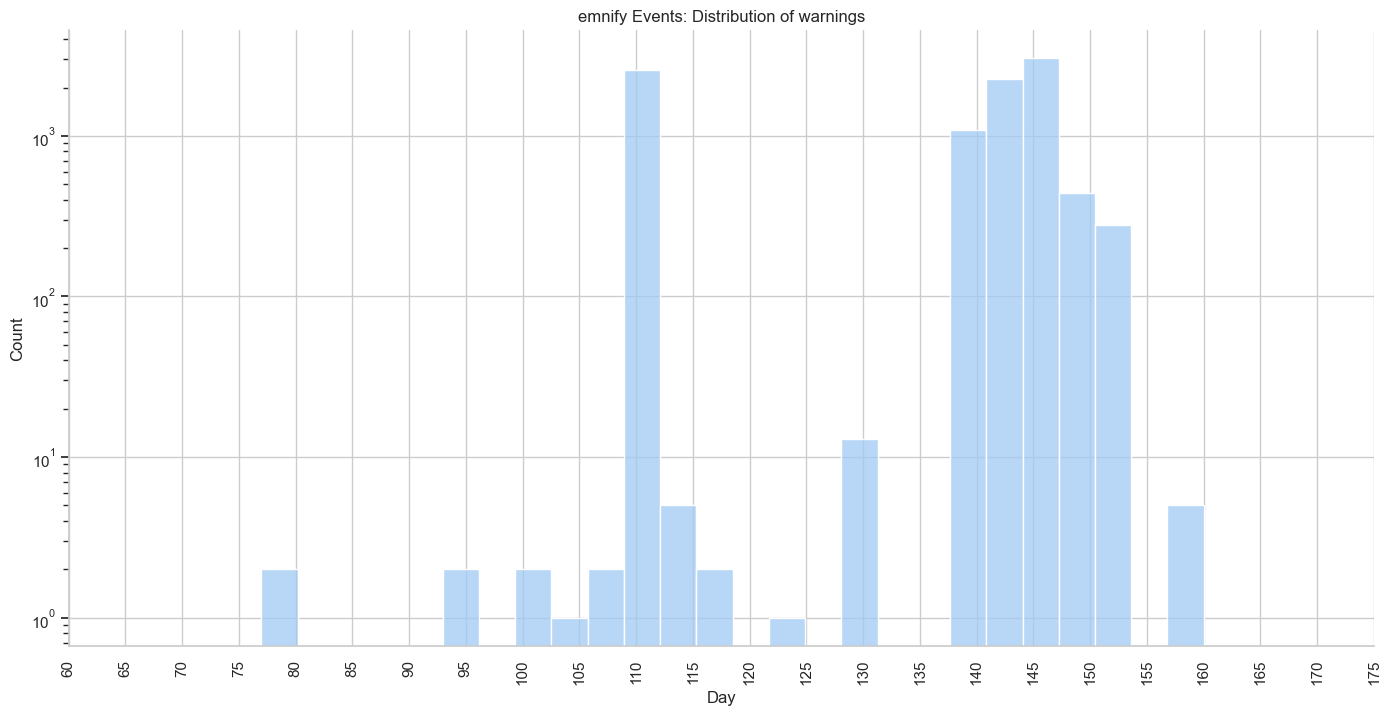
The description contains very long, detailed messages that are often very similar but can vary by something as minor as a mobile network provider’s IP address.
By using only the first 30 characters, you can categorize such events as duplicates despite these insignificant differences.
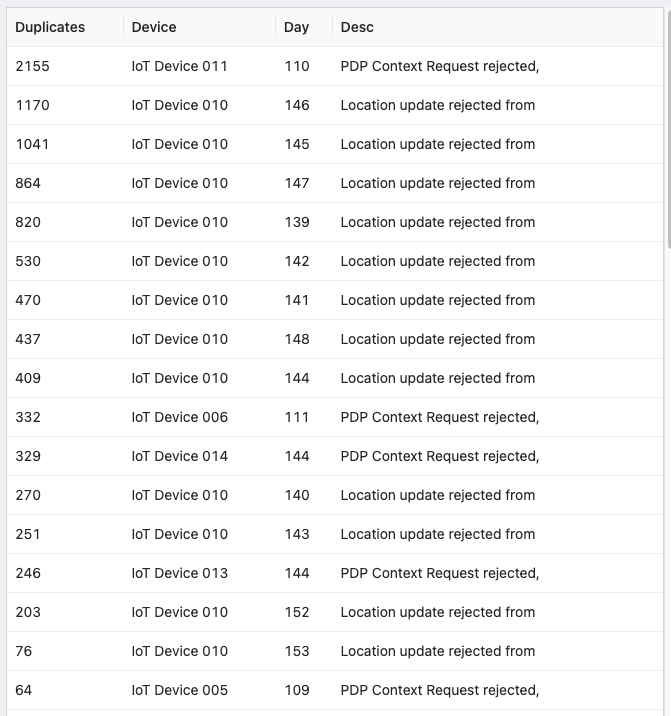
View/copy the SQL for this query
USE emnify;
SELECT COUNT(*) AS "Duplicates",
       "endpoint.name" AS "Device",
       DAYOFYEAR(timestamp) AS "Day",
       SUBSTRING("description",1,30) AS "Desc"
FROM   events
WHERE  "event_severity.id" = 1 /* WARNING */
GROUP BY "Day",
         "Device",
         "Desc"
ORDER BY "Duplicates" DESC,
         "Device",
         "Day",
         "Desc";
The first 15 rows of these query results indicate that over 9,500 of these warning events are duplicates. This shows that 72% of the 13,299 events the emnfiy Data Streamer sent were essentially worthless.
The histograms above are confined to events that have a severity of Warning.
Given a count of 9,748 warning events, this means that less than 3% of the warning events collected from the emnify Data Streamer are significant.
Next, you will learn how to leverage SQL and pandas DataFrames to isolate and remove duplicates from your emnify warning events.
The filter (warnings only) and new field Desc (the description field with all but the first 30 characters truncated) will pave the way for dropping superfluous events.
USE emnify;
SELECT DAYOFYEAR(timestamp) AS "Day",
       "endpoint.name" AS "Device",
       timestamp,
       SUBSTRING(description,1,30) AS "Desc"
FROM   events
WHERE  "event_severity.id" = 1
ORDER BY timestamp;
First, you will construct a Python dictionary called previous that uses the IoT device name as a key and the truncated description Desc as its value.
This will serve as a lookup table for seeing if the current device has the same Desc value as the previous one while you iterate through each row of the DataFrame that Raijin has already sorted by timestamp.
If you use the current IoT device’s name as the key for returning its previous Desc value, and it matches the Desc value for this row, a duplicate has been detected.
In this case, the DataFrame drop function removes it.
# Create the DataFrame from the query
events = queryRaijin('emnify-events-warning-truncated-description.sql')

# Iterate through each row of the DataFrame to find and drop duplicates
previous = {}
for index, row in events.iterrows():
    device = row['Device']
    if type(device) == str:
        if device in previous:
            if row['Desc'] == previous[device]:
                # Drop this duplicate row
                events = events.drop(labels=index, axis=0)
        previous[device] = row['Desc']

# Define the histogram plot
warnings = sns.histplot(
    events,
    x='Device',
    hue='Device'
)

# Create a title and override the default axis labels
warnings.set(
    title='emnify device warnings (All dates)',
    xlabel='Registered Devices',
    ylabel='Event Count'
)
plt.xticks(plt.xticks()[0], rotation=60)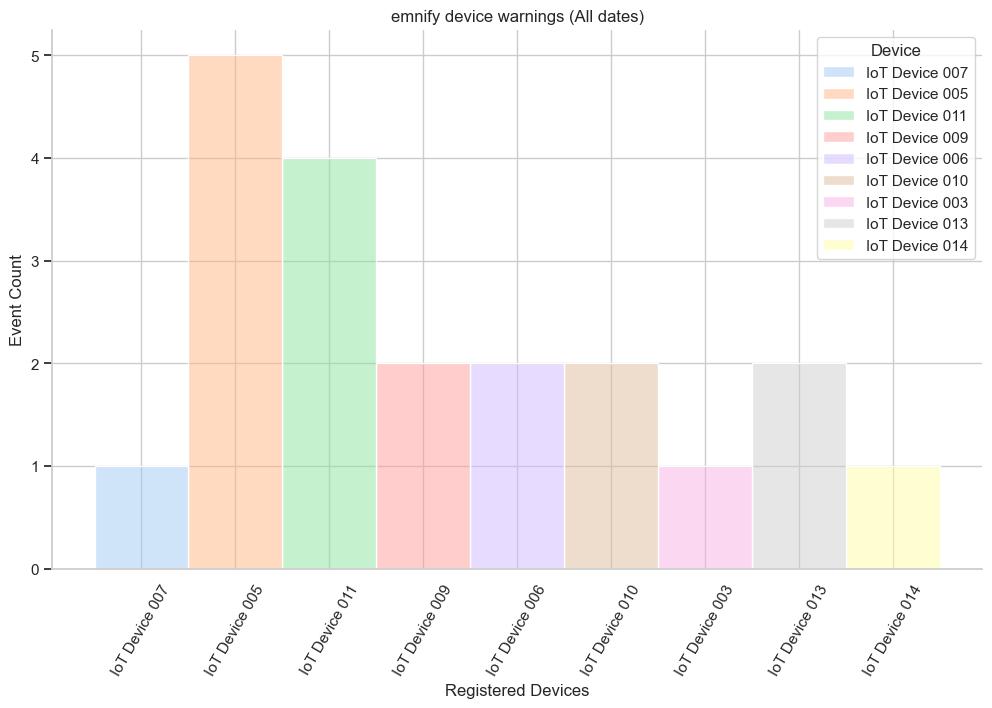
After plotting this cleaned data, you can see that IoT Device 011 only has 4 significant warnings, not 2,155.
Plotting data usage
emnify logs sessions of data usage based on bursts of data transmissions using beginning and ending timestamps:
-
start_timestamp -
end_timestamp
If you would like to work with a more logical pair of field names, e.g., start/stop, ts_begin/ts_end, t0/t1, etc., you could use the rename_field procedure in your NXLog configuration file to customize these or any other field names.
|
If you want to analyze the duration of data sessions, you could use milliseconds as a unit of time. However, the shortest duration recorded in this dataset of 6,410 sessions was 3.027 seconds.
For aggregating data over any time interval, the best practice is to use the timestamp that marks the completion of the data transmission.
In this case, end_timestamp.
emnify data usage for a specific month
data_usage = queryRaijin('emnify-data-usage-may-2023.sql')
data_usageUSE emnify;
SELECT "endpoint.name" AS "Device",
SUM("volume.rx") AS "RX",
SUM("volume.tx") AS "TX",
SUM("volume.total") AS "Combined",
SUM( (end_timestamp - start_timestamp)/1000000) AS "Duration",
COUNT("endpoint.name") AS "Sessions"
FROM usage
WHERE YEAR(end_timestamp) = 2023
AND MONTH(end_timestamp) = 5
AND "traffic_type.description" = 'Data'
GROUP BY "endpoint.name",
month
ORDER BY "endpoint.name";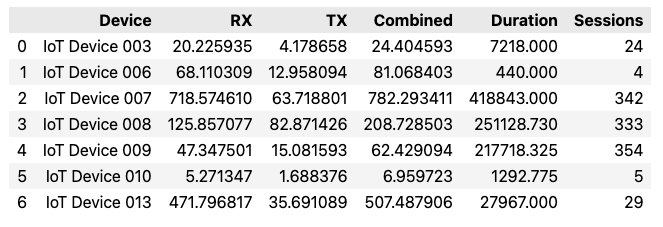
u5 = sns.barplot(
    data_usage,
    x='Device',
    y='Combined',
    hue='Device',
    dodge=False
)
u5.set(
    title='Data usage by emnify-enabled device (May 2023)',
    xlabel='',
    ylabel='Combined (RX/TX) data throughput (MB)',

)
plt.xticks(plt.xticks()[0], rotation=60)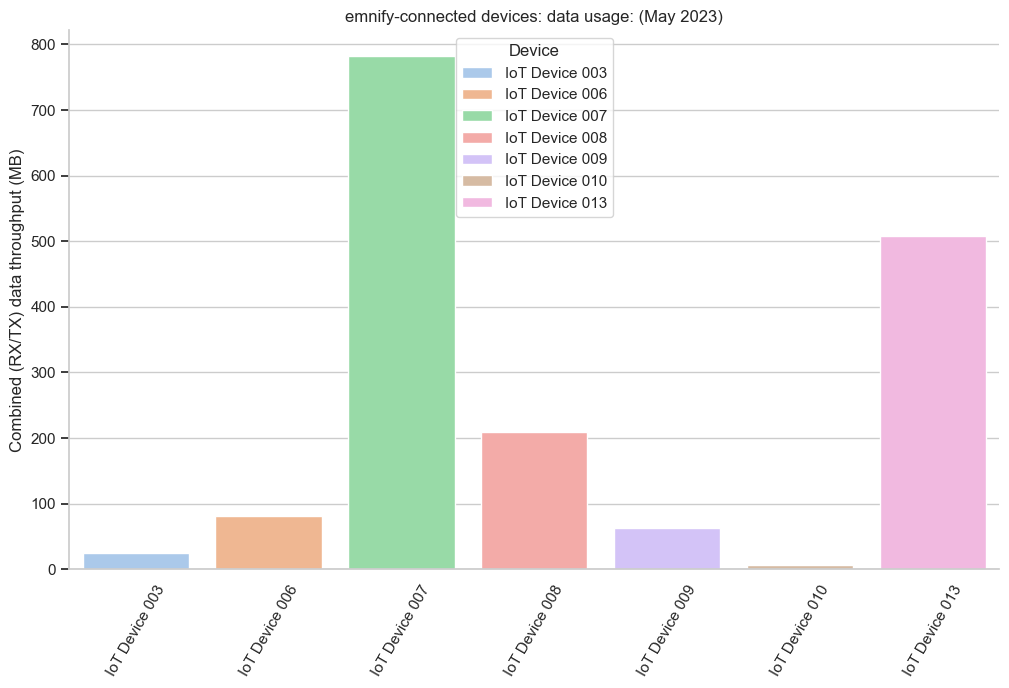
Create a report of data usage by month
In this exercise, you will create a plot of data usage by month for two categories: data transmitted and data received.
data_usage = queryRaijin('emnify-data-tx-rx-by-month.sql')
data_usage
The SQL query aggregates the appropriate fields by month.
USE emnify;
SELECT SUM("volume.rx") AS "Data RX",
       SUM("volume.tx") AS "Data TX",
       MONTH(end_timestamp) AS month
FROM   usage
WHERE  YEAR(end_timestamp) = 2023
  AND  "traffic_type.id" = 5 /* data usage */
GROUP BY MONTH(end_timestamp)
ORDER BY month;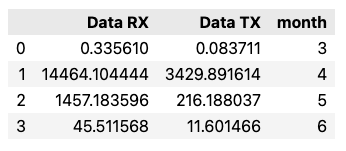
# Create a new column in the dataset containing the month name
months = {
    1:'January',
    2:'February',
    3:'March',
    4:'April',
    5:'May',
    6:'June',
    7:'July',
    8:'August',
    9:'September',
    10:'October',
    11:'November',
    12:'December'
}
data_usage['Month'] = data_usage['month'].map(months)
data_usage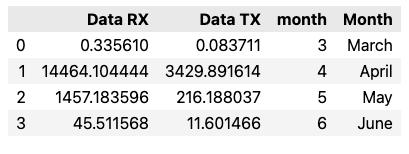
# Create a "Mode" column as a category to differentiate TX from RX
# Move TX and RX values (data usage in MB) to a new "MB" column
data_usage = data_usage.melt(
    id_vars=['month','Month'],
    value_vars=['Data RX','Data TX'],
    var_name='Mode',
    value_name='MB'
)
data_usage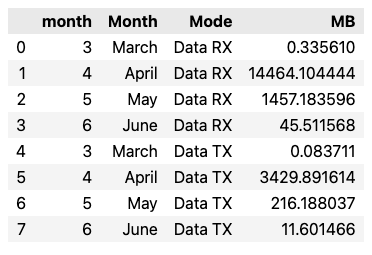
In the following Jupyter Notebook code cell, the seaborn barplot() function takes a category Mode and creates a bar chart of both values, either Data RX or Data TX.
sp = sns.barplot(
    data_usage,
    x='Month',
    y='MB',
    hue='Mode'
)
sp.set_yscale("log")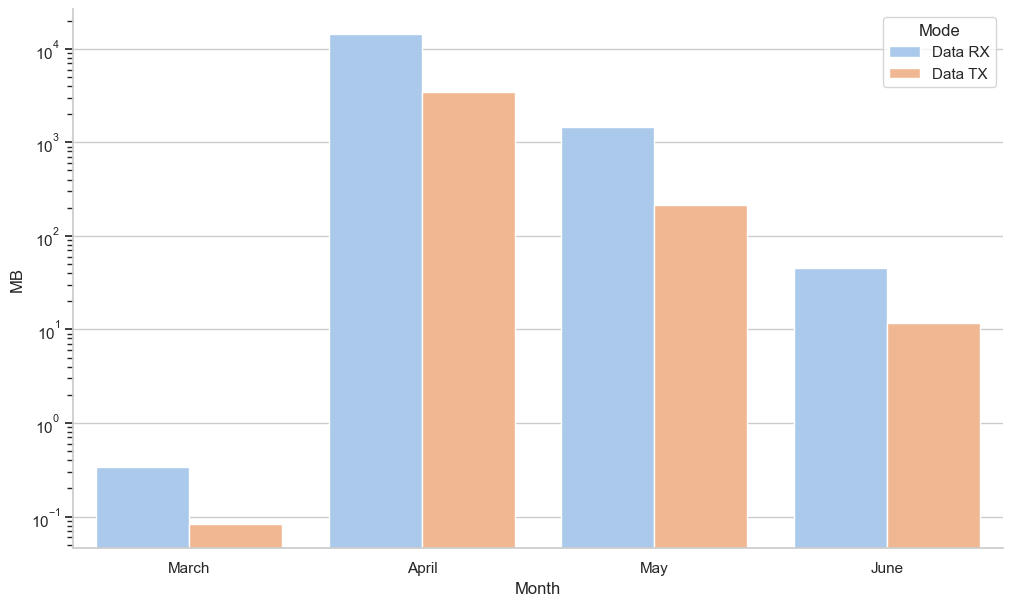
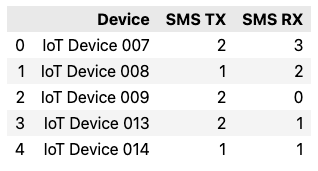
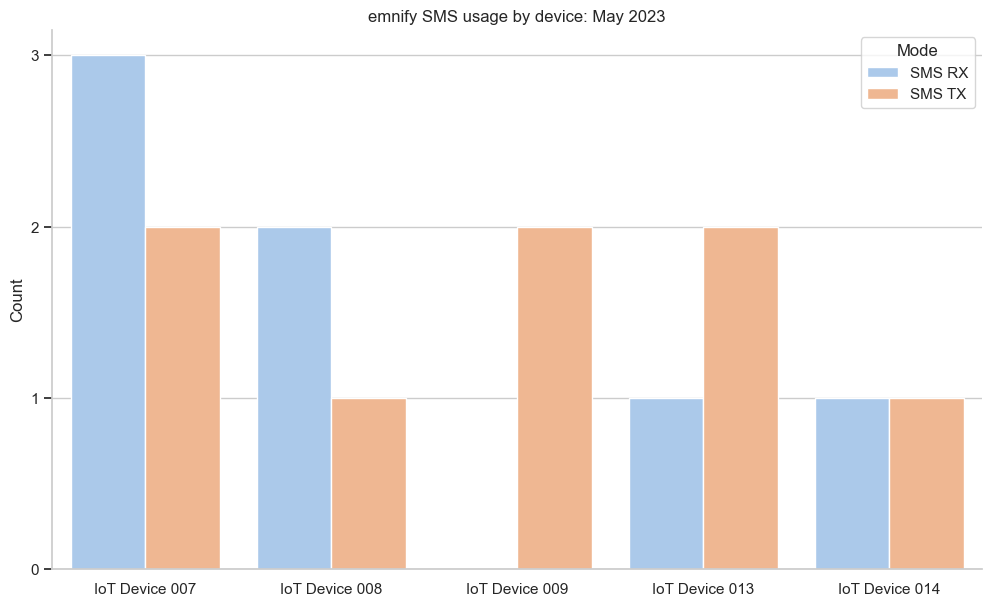
Create a report of SMS usage for May 2023
sms_usage = queryRaijin('emnify-sms-tx-rx-by-device-may-2023.sql')
sms_usageUSE emnify;
SELECT "endpoint.name" AS "Device",
SUM("volume.rx") AS "SMS TX",
SUM("volume.tx") AS "SMS RX"
FROM usage
WHERE YEAR(end_timestamp) = 2023
AND MONTH(end_timestamp) = 5
AND "traffic_type.id" = 6 /* SMS usage */
GROUP BY "endpoint.name"
ORDER BY "Device";
Because emnify uses volume.rx for sent SMS messages and volume.tx for SMS messages received, you need to switch the field labels in the SQL query as shown above.
Detailed documentation regarding this issue was made available to emnify in May 2023.
To date, no response has been received.
Thus, one could conclude that this issue might never be pursued.
|
# Set the y-axis tick values to integer instead of floating point
from matplotlib.ticker import MaxNLocator
ax = plt.figure().gca()
ax.yaxis.set_major_locator(MaxNLocator(integer=True))

# Create the SMS usage bar chart using Mode to differentiate between RX and TX
sms_plt = sns.barplot(
    sms_usage,
    x='Device',
    y='Count',
    hue='Mode'
)
# Create a title and remove the superfluous x-axis label
sms_plt.set(
    title='emnify SMS usage by device: May 2023',
    xlabel=''
)
Summary
By hosting your own emnify metadata, you are no longer limited to the fixed set of reports that emnify provides. Once you are free from the multitenancy of the emnify Portal, you can generate multiple reports in a fraction of a second, rather than a fraction of a minute for a single report.
Now that you have completed this tutorial, you have the foundation for creating custom reports for your organization. Even though these exercises are specific to emnify’s IoT metadata, you are now equipped to apply the concepts you have learned to other types of log data.
Copyright © 2023 John Kirch